

The next step in data linking

Integrating existing science and innovation databases to enrich our knowledge base for policy support.
In the field of Science, Technology and Innovation (STI), there is a tradition of large-scale data collection. The EU launched its first large-scale monitoring initiatives — the INNO Policy Trendchart and European Innovation Scoreboard — in 1999 and 2000 respectively, followed by several other STI-focused monitoring platforms, observatories and projects. This has resulted in huge datasets, collected through networks, surveys and statistical offices. Increasingly, this data is available in open data formats, via open data portals.
Is this big data? Probably not, but it is certainly a lot of data, especially if we link different types of datasets and use them to explore the interplay of large numbers of variables.
Multiplying mess
Given the ‘messiness’ of individual STI datasets (missing data, etc.), one of the main challenges of such data linking is avoiding a ‘messiness multiplier’ when linking datasets collected for different purposes using different designs (e.g. different perspectives, definitions, data collection methods, reliability levels, etc.).
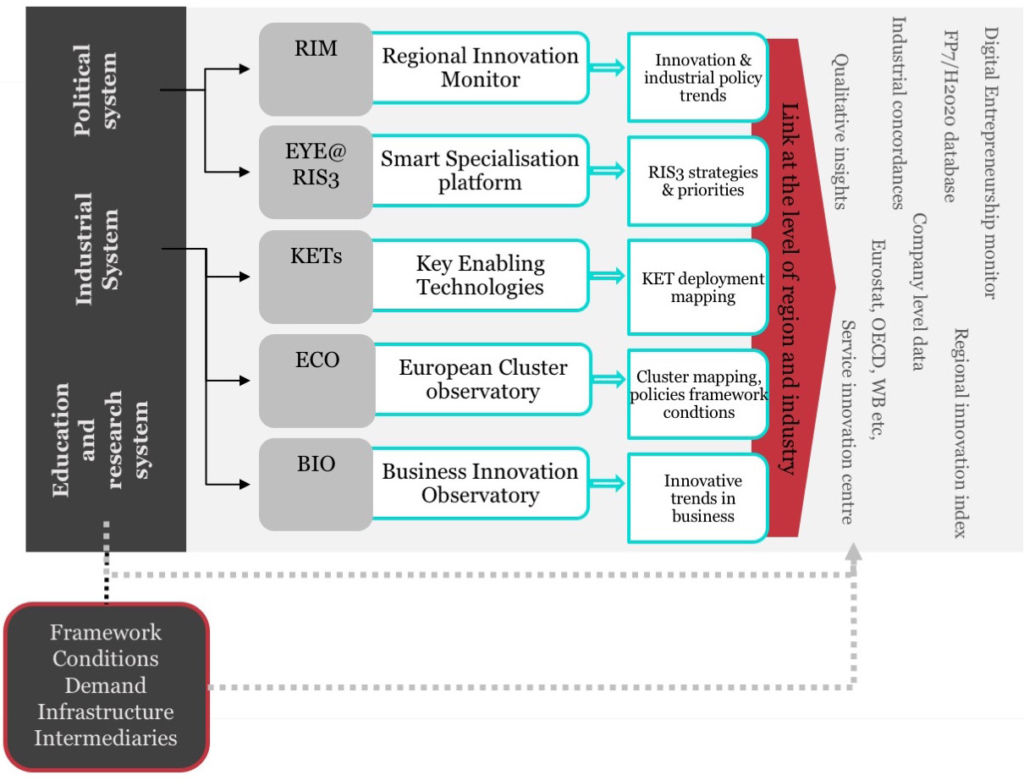
For example, consider the contrasts between business and policy-maker centred designs (e.g. Business Innovation Observatory vs Regional Innovation Monitor), or between thematically focused (i.e. policy, industry or technology-specific), STI-system encompassing (Key Enabling Technologies Observatory, European Cluster Observatory or European Innovation Scoreboard) and value-chain inspired designs (e.g. the up-coming RE-Confirm).
So it is natural to question whether an integrated monitoring system would be of greater value than the sum of its parts — and its ability to support policy design.
Technopolis Group recently used data linking in a comparative analysis of the national ‘Smart Specialisation Strategies’ in Central Europe. The study identified seven common ‘technology priority areas’ using data from five different sources: the Smart Specialisation Platform (EYE@RIS3), FP7/H2020 databases, the European Cluster Observatory, the Key Enabling Technologies Observatory and OECD trade data. This selection was then verified based on analysis of R&D capacities (upstream), clustering and patenting (midstream) and business or economic activity in the respective technology areas (downstream).
The next step
A takeaway from the project is that the public sector needs support in anticipating new developments. Traditional STI databases are useful but have limitations when it comes to informing policy at a high level of granularity (e.g. in terms of industry segments/niches) or capturing dynamics on the ground.
An integrated monitoring system would make such work more efficient and enable more data to be consulted in one go (‘integrated dashboards’) — e.g. to test hypotheses and identify information gaps. But to make the next step, and truly enrich our knowledge base, we need to turn the traditional STI indicators collected by these observatories and other projects into ‘real’ big data: In other words, data linking that uses reliable STI concepts and structures for markets, industries and regions, but also acknowledges the strengths of using web scraping, social media, and Wikipedia data to identify emerging technologies, new application areas and new markets.
")

